Unwrap ability from 2.71 to 2.72a

Anybody know why Blender 2.72(a) would scale less than Blender 2.71 when UV unwrapping? I’m seeing the following behavior only with 2.72a and I’m hoping someone else can confirm the behavior:

Blender version: blender-2.72a-windows64 and blender-2.72-windows64

Repro steps:

  1. Open Blender
  2. Delete default cube
  3. Add Mesh –Plane
  4. Press S to Scale Plane, and type 10 as scaling factor
  5. Tab to Edit mode
  6. Subdivide Plane, number of cuts: 1000
  7. Press U and select Unwrap

After processing the Unwrap command for a while Blender quits with the following error on the Console:
Can’t expand MemType 0: jcol 1210311

Obviously, 1000 cuts is large and it takes a while to create those ~1M faces and then awhile to unwrap the mesh. I have a substantial amount of hardware and thus I do not believe it’s a hardware thing.

Blender 2.71 (blender-2.71-windows64) can consistently complete the repro steps above without problem. Blender 2.72a fails consistently with the error above. Thoughts?

Sure, report it as a bug.

Hi Atom - Did you confirm behavior or was that merely a suggestion?

Can anyone else can confirm this behavior? If so, I will happily log a bug. Thanks.

Can’t expand MemType 0: jcol 1126774
Writing: /tmp/blender.crash.txt
Segmentation fault (core dumped)

Ubuntu 14.04 64 bit

Thanks organic. Bug reported here: https://developer.blender.org/T42318

I could use the assistance of someone with a 64 bit OS and 32GB or more of RAM to run the test above using Blender 2.71 and 2.72. I consistently see 2.71 succeed and 2.72 fail which indicates an application and not an OS or hardware issue. Any takers?

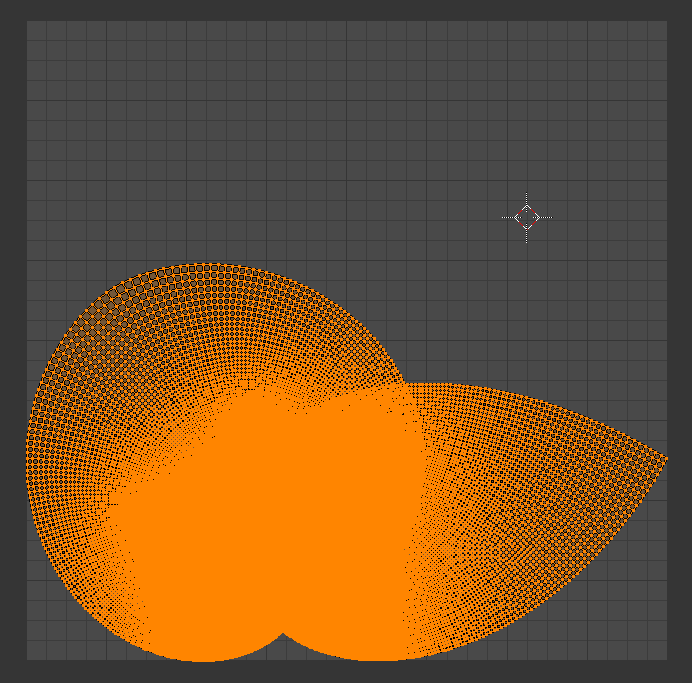
A bit of a pita - i have 5GB RAM only and gave 200, then 4 subdivisions totaling into just above 1 Mil verts. Took some 20 minutes or so to crash :D.


# Blender 2.72 (sub 2), Commit date: 2014-11-17 14:20, Hash 9880574
bpy.ops.object.delete()  # Operator
bpy.ops.mesh.primitive_plane_add(radius=1, view_align=False, enter_editmode=False, location=(0, 0, 0), layers=(True, False, False, False, False, False, False, False, False, False, False, False, False, False, False, False, False, False, False, False))  # Operator
bpy.ops.transform.resize(value=(10, 10, 10), constraint_axis=(False, False, False), constraint_orientation='GLOBAL', mirror=False, proportional='DISABLED', proportional_edit_falloff='SMOOTH', proportional_size=1)  # Operator
bpy.ops.object.transform_apply(location=False, rotation=False, scale=True)  # Operator
bpy.ops.object.editmode_toggle()  # Operator
bpy.ops.mesh.subdivide(smoothness=1)  # Operator
bpy.data.window_managers["WinMan"].(null) = 200  # Property
bpy.ops.mesh.subdivide(number_cuts=200, smoothness=1)  # Operator
bpy.ops.uv.unwrap(method='ANGLE_BASED', margin=0.001)  # Operator
bpy.context.area.type = 'IMAGE_EDITOR'  # Property
bpy.ops.mesh.subdivide(smoothness=0)  # Operator
bpy.data.window_managers["WinMan"].(null) = 4  # Property
bpy.ops.mesh.subdivide(number_cuts=4, smoothness=0)  # Operator

# backtrace
/home/User/Desktop/GB3() [0xff840b]
/home/User/Desktop/GB3() [0xff8661]
/lib/x86_64-linux-gnu/libc.so.6(+0x364a0) [0x7f4324f864a0]
/home/User/Desktop/GB3(Destroy_SuperNode_Matrix+0x8) [0x1ea2a98]
/home/User/Desktop/GB3(nlDeleteContext+0x16c) [0x1ea0f8c]
/home/User/Desktop/GB3() [0x11d53f1]
/home/User/Desktop/GB3(param_lscm_begin+0x198) [0x11d6788]
/home/User/Desktop/GB3(ED_unwrap_lscm+0x94) [0x11d0d44]
/home/User/Desktop/GB3() [0x11d0ffc]
/home/User/Desktop/GB3() [0x10152e2]
/home/User/Desktop/GB3() [0x10157e0]
/home/User/Desktop/GB3() [0x13011f6]
/home/User/Desktop/GB3() [0x131285d]
/home/User/Desktop/GB3() [0x1016b6b]
/home/User/Desktop/GB3() [0x1016f16]
/home/User/Desktop/GB3(wm_event_do_handlers+0x1ba) [0x101722a]
/home/User/Desktop/GB3(WM_main+0x18) [0xfffda8]
/home/User/Desktop/GB3(main+0x50b) [0xffacd5]
/lib/x86_64-linux-gnu/libc.so.6(__libc_start_main+0xed) [0x7f4324f7176d]
/home/User/Desktop/GB3() [0xefcbf1]

I’ll see if i could do for more ancient versions.
Edit: Linux Mint, 64 bit here.

Thank you eppo. As it’s a RAM related issue, I’m really looking for a test using 32GB or greater so actual out of memory conditions do not generate false a positive.

Care to elaborate what you try to prove with this further testing?
You already filed a bug report and from my understanding you also got an explanation from one of the devs. And if even you can’t unwrap this on your beastly machine due to memory limitations, what’s the point in us others trying?

The goal is to verify my suspicion that it’s an application software bug and not an operating system or hardware limitation (as suspected by the dev). Assuming others not limited by OS/HW also see the issue, I will reach back to the dev to encourage a bug fix.
The idea that Blender is unnecessarily software limited is bothering me more than it should.

Ah, so it’s a quest for truth! How could I resist…:wink:
I can confirm your findings, my PC’s specs are in my sig. Memory consumption of the blender-app.exe (2.72b) / blender.exe (2.71) stayed below 9.something GB at all times.

A few observations:

  • 2.72b “feels” significantly faster than 2.71 on performing these operations (well, the cuts, as it crashes with the unwrap).
  • This is the unwrap result I get from 2.71…


…which is plain weird considering that the unwrapped object is a flat plane. So, 2.72 = crash and 2.71 = unusable result. You might call that a draw…

I did not mention - i had my HD spinning red like F1 brake disks starting from approx 2.2 Gb RAM usage and swap file is set to be another 5Gigs. Last time i did pay attention to what’s going on RAM usage was 3Gb and gradually falling; i decided it will finish and covered system monitor. After short Blender crashed.
Blender has done different tasks here with significantly more geometry involved taking almost all reserve and yet survived so i don’t think it run into resource limit this time. I might be wrong assuming this ofc.

@IkariShinji Time Warp? :smiley:

It’s just a jump to the left… :eyebrowlift:

One thing I forgot to mention: Just before the crash the memory consumption got increasingly erratic. Up to that point it had been increased slowly and steadily, then it suddenly jumped up and down in 2 GB steps and boom.

Many thanks IkariShinji. I have updated the bug report and hopefully we’ll get to the bottom of things. I’ll take an unwrap that requires work than a crashed Blender any day.

A 2.71 unwrap using the repro steps above produces the following for me:


2.71 unwrap when the plane is scaled in Edit mode gives me the following:


Hopefully results with 2.72+ will improve if we can get it to work without crashing. I’ve also tested with 2.73 Test Build and it’s also crashing.

The developer has made the following code changes which have fixed this issue: http://www.miikahweb.com/en/blender/git-logs/commit/7a04c7f6d02a90388e722bf3a600327b52c744ac

I tested with BuildBot blender-2.72-7a04c7f-win64.zip (2014-12-19) and memory usage appeared less erratic with 14.5GB allocated immediately and staying around 15GB during the operation. 2.72+ UV unwrap now works as expected resulting in a perfect square.

Thanks to all who helped test, IMHO it’s a win for Blender UV unwrap scalability.