Dear all,
this may eventually turn into a thread about Logic optimization, but right now I have a few concerns about Profile behavior.
Please note that I’ve already read Moguri’s “BGE Profile Stats and What They Mean” post on his blog, but this didn’t seem to end my doubts.
Here is the situation:
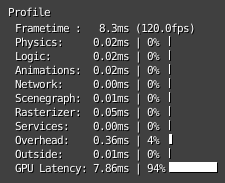
Suppose you have the default cube rotating around its Z axis and nothing more. “Use frame rate” in the Property panel is checked and Vsync is turned Off
This is the profile I get:
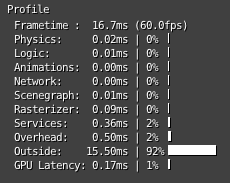
Within this situation, if I check my OS Task Manager, I see Blender is using about 20% of my CPU.
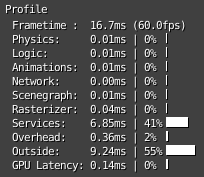
Same situation, this time “Use frame rate” is unchecked and Vsync is still Off:
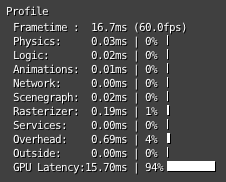
Within this situation Task Manager shows Blender is using about 3% of my CPU.
I really don’t know how to interpret all this.
If you take for example the latest situation, I would expect Blender starting a Game Loop each 1/60 s (about 16,7 ms). This is just because, in absence of a given Logic Frame Rate, it seems to me that BGE sets it to the current display refresh rate (I’ve tested this on a 120Hz refresh rate display where logic speed seems to doulbe due to the higher refresh rate - indeed the Cube is rotating faster).
So, due to the current Scene simplicity, I would expect both the Scene Loop and the Render phase to end pretty soon, followed by the GPU buffer swap.
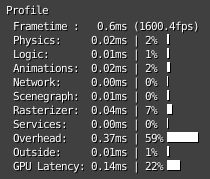
A Profile that would make sense for me in this situation would be something like this:
Outside --> almost 0%
Rasterizer --> almost 0%
GPU Latency --> almost 0%
Waiting for a new Game Loop to start (not existing entry in the current Profile!) --> about 99%
As for the moment it seems like non-processing time eventually ends up either in the Outside entry or in the GPU Latency entry, which makes it seem like some external process or Vsync delay is waisting your time.
Moreover I don’t understand why Unchecking “Use frame rate” would spare about 17% of my CPU usage if, in the end, the Logic Frame Rate still remain 60 FPS.
Sorry for the dull explanation, but I couldn’t find a better way to point out my concerns…
NIV
PS: Please see attached if you don’t want to reproduce the above-mentioned Scene by yourself
Attachments
Profile_concerns.blend (481 KB)

 ).
).