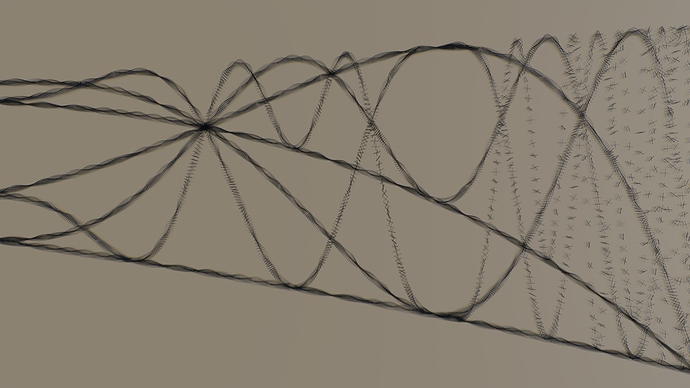
I’ve just started learning python. For one of my first test scripts I’ve been playing with the Mandelbrot set.
I’m sure this has been done here somewhere but it’s all new to me so I thought I would share for feedback.
Maybe someone could make a cool image with the code.
import bpy
print ("-+"* 50)
ob = bpy.context.object
first function with mandelbrot equation and operator to copy objects
def f(x,c,move,f_range):
for h in range(0,f_range):
x = x**2 + c
copy = ob.copy()
copy.location.x = x+x30
copy.location.y = move
copy.rotation_euler.z = move.1
copy.rotation_euler.y = x10
bpy.context.scene.objects.link(copy)
#bpy.ops.mesh.primitive_plane_add(radius=.3, location=(x+x30, move, x+x*25))
#print (x)
def f2(f2_range,f2_variation):
moved = 0
y = -1.35 #initial value for equation
print
for i in range (0,f2_range):
        moved = moved +1
        f(y, y, moved,7)
        y = y + -f2_variation


        print("iterated",i)


#number of iterations,       amount to increase initial value
f2 (700, .001)
#with current values, numbers larger than 700 stray outside the pattern.
#!!!you must have an active object selected!!!#
Attachments
oooooooooo so what do you do. copy this code into text editor, and run it . i llove this mandelbrot stuff. can you make it an add-on.
cant run script keep getting f2 not definded. really want this to work HELP
Thanks for the tip CD38. I was wondering how to do that. I’ll keep it in mind for updates.
To make the code work, paste it into the text editor. You need to have an active object selected. Then run the script. The active object can be anything. I have an extra line of code in there that rotates the object on the y axis as it’s iterating through the feedback loop. I used that x shape you see in the renders but it might look cool with Suzanne or something.
It’s not ready for addon status yet. I’m using the Mandlebrot set with the first part of the equation for getting those famous fractals. I haven’t figured out how to make python work with the second part using imaginary numbers and the complex number graph. If someone with a lot more python experience has some tips on that it would be much appreciated.
For now the code works by plotting objects on the z axis with values for the feedback loop between 0 and -2 then offsetting the next set on the x axis with a slightly different value. It’s cool how the sine waves converge in different combinations.
Thanks for viewing!
I’ll try to provide updates.
ok first no 2nd try got it to run but it crashed on 699 iterations did’nt have the 3d window all the way open so could’nt see what it did. i know it tried to do it cause there’s more than one of the object.and from what i could tell over 3 million vert’s ha. should i have really low poly.object only had like 30 vert’s. trying again.
finally got it to work wohooo
dont know if this will show up bigger but here goes
Dang! That’s cool. Kinda creepy. Definitely has an eye-popping effect when you first look at it.
thanks, just a quick one. gonna try something a little more ambitious this weekend. see how far i can push it.change some numbers.


